Difference in Proportions: Simulation
Lecture 11
NC State University
ST 511 - Fall 2024
2024-09-25
Checklist
– Are you keeping up with Slack?
– Quiz-5 Wednesday (due Sunday)
– Exam-1: October 9th (in-class)
– Exam-1: Assigned October 9th; Due 11:59pm October 15th
Announcements
Today, we are going to cover inference for difference in proportions (simulation based). In addition to the prepare material, I have created a walk through that goes into detail on inference for difference in proportions (theory-based). Please email, or post questions in slack if you have any questions with the content.
Extra credit
Extra credit opportunity: Prepare material for Monday (Sep-30th)

5-10 minute survey Qualtrics survey on if this applet helped!
Sports analytics competition

New context; Similar methodology
Penguins
We are interested in exploring if the species of the penguin impacts the sex of the penguin on the Palmer island. We will be looking at the Chinstrap and Gentoo species of penguin. We are interested in researching if there are more male Gentoo penguins than male Chinstrap penguins.
– What are the variables?
– What is a success?
– What is the null and alternative hypothesis?
Null and Alternative
\[H_o: \pi_g - \pi_c = 0\]
\[H_a: \pi_g - \pi_c > 0\]
The Data
The Data
\(\hat{p}_\text{gentoo}\) = \(\frac{61}{119}\) = .513
\(\hat{p}_\text{chin}\) = \(\frac{34}{68}\) = .5
\(\hat{p}_\text{gentoo} - \hat{p}_\text{chin} = .013\)
The assumptions
– Independence (always)
– success-failure
Independence
Within group
Across group
Success failure
Recall that the null hypothesis suggests that the true proportion of male Gentoo penguins is the same as the true proportion of male Chinstrap penguins.Or, we can think about this as THE SPECIES DON’T MATTER. Just like in the single categorical variable scenario, we are going to check this condition under the assumption of the null hypothesis. It looks like this!
Success failure
\(\hat{p}_\text{pool}\) = \(\frac{\text{total successes}}{\text{total sample size}}\)
\(\hat{p}_\text{pool}\) = \(\frac{\text{34+61}}{\text{68+119}}\) = 0.508
\[ n1*\hat{p}_\text{pool} > 5 \]
\[ 119*.508 > 5 \]
\[ n1*(1-\hat{p}_\text{pool}) > 5 \]
\[ 119*.492 > 5 \]
Simulation assumptions
\[ n2*\hat{p}_\text{pool} > 5 \]
\[ 68*.508 > 5 \]
\[ n2*(1-\hat{p}_\text{pool}) > 5 \]
\[ 68*.492 > 5 \]
Simulation
Permutation test - randomly shuffling data and calculating our summary statistic.
What does this look like?
Steps
Combine all our data, regardless of the explanatory variable (species)
Shuffle data into two new groups of the same size n1 and n2
Calculate the proportion of males for each new group
Subtract them
Do this process many many times to get your sampling distribution!
What if we want to estimate \(\pi_g - \pi_c\)? What inference tool can we use instead of hypothesis testing?
Confidence intervals
We make confidence intervals when we want to estimate population parameters. The big change is that we don’t have a null hypothesis to assume true. This means that we check assumptions a little differently than before…..
Recall with testing
\(\hat{p}_\text{pool}\) = \(\frac{\text{total successes}}{\text{total sample size}}\)
\(\hat{p}_\text{pool}\) = \(\frac{\text{34+61}}{\text{187}}\) = 0.508
\[ n1*\hat{p}_\text{pool} > 5 \]
Now
We don’t use \(\hat{p}_\text{pool}\) because we are not making the assumption of the null hypothesis that the species doesn’t matter!
We use our original data!
\[61 > \text{5 success for group 1}\]
\[58 > \text{5 failure for group 1}\]
\[34 > 5\text{5 success for group 2}\]
\[34 > \text{5 failure for group 2}\]
Simulation
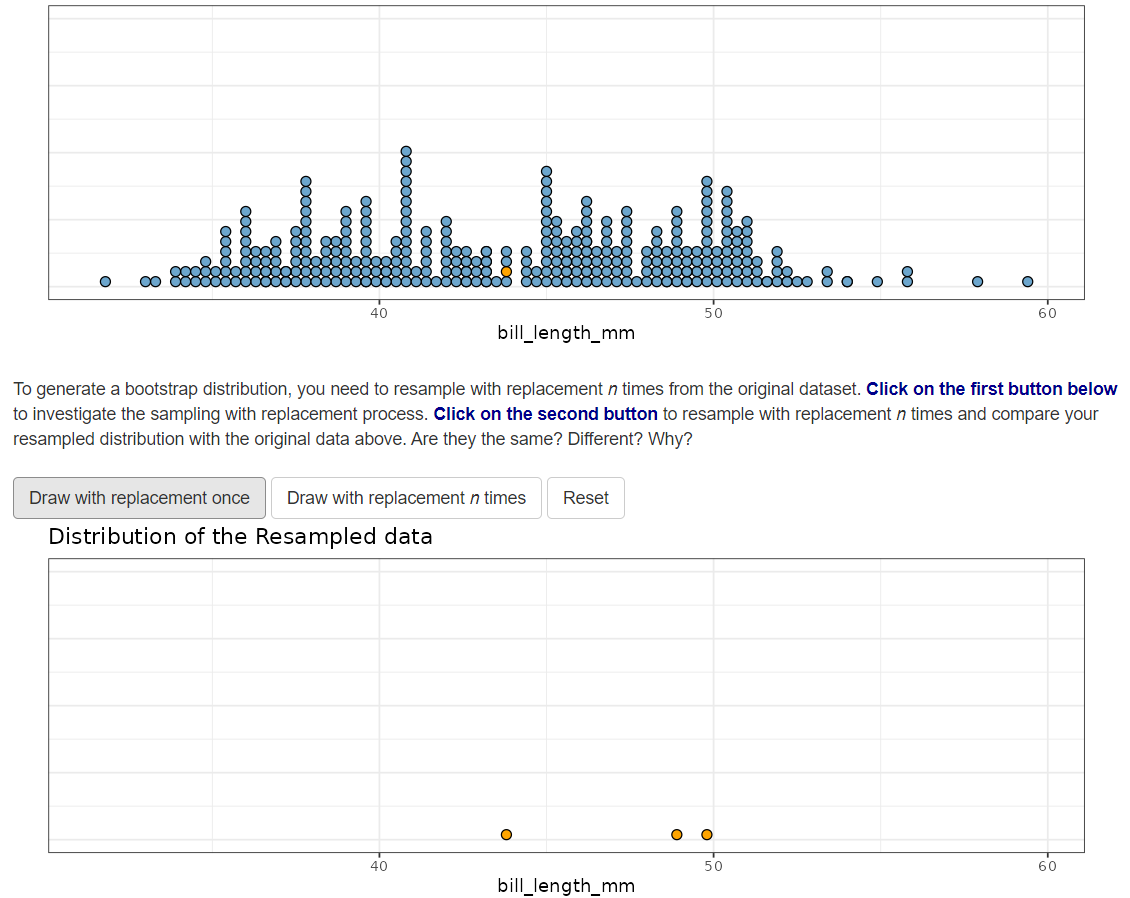
Bootstrap resample - randomly sample with replacement and calculating our new simulated summary statistic.
What does this look like?
Practice with the p-value
At \(alpha\) = 0.05…
Decision
Conclusion
Interpretation
Practice with the confidence interval
Interpretation
What’s the meaning of your 95% confidence level?
