               Estimate Std. Error t value Pr(>|t|)
(Intercept)     121.956      2.855  42.715        0
bill_length_mm    0.549      0.080   6.859        0
body_mass_g 0.013 0.001 23.939 0Regression IIII
Lecture: …
NC State University
ST 511 - Fall 2024
2024-11-13
Checklist
– Keep up with Slack
– HW 4 (late window tonight 11:59)
– HW 5 has been released (due Sunday at 11:59)
– Quiz 10 (released Wednesday; due Sunday Nov 10)
– Download today’s AE
HW-3
– Grades are posted (check after class)
– Key coming out tonight
– Regrade window will be announced on Slack
Homework schedule
Overlapping homework are not idea, but it gives you flexibility on when to complete assignments
– Homework 5 due Tuesday (Nov 19th at 11:59)
– Homework 6 assigned Monday (Nov 18; due Tuesday Nov 26)
This gives more time + an additional office hour for Homework 5 (if needed)
Class check-in
Reported difficult concepts
– ANOVA, Chi-square, Tukey HSD, the distributions, as well as the degree-of-freedom for the distributions
– which method should be used for different scenarios/data sets
– difference between p-values and confidence intervals
– difference between theory and simulation scenarios
Last Time
\(\widehat{\text{flipper length}} = 147.563 + 1.10*\text{bill length}\) \(- 5.25*\text{Chinstrap} + 17.55*\text{Gentoo}\)
\[\begin{cases} 1 & \text{if Chinstrap level}\\ 0 & \text{else} \end{cases}\] \[\begin{cases} 1 & \text{if Gentoo level}\\ 0 & \text{else} \end{cases}\]Quantitative explanatory variables
flipper length ~ body mass + bill length

Model Output
How do we interpret body mass in the context of the problem?
AE Interaction Model
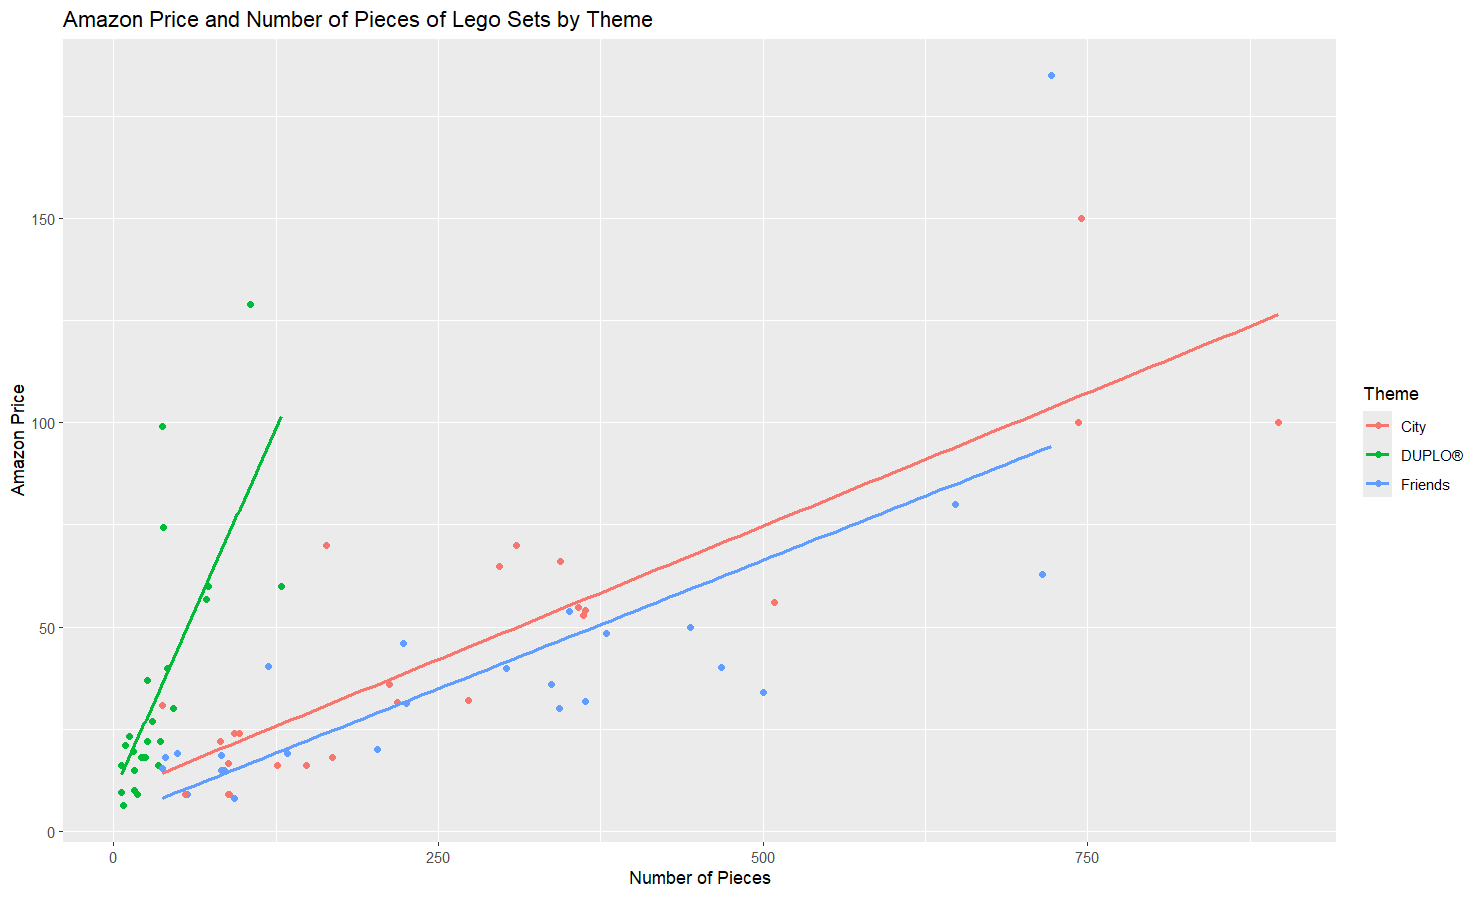
Which model should we fit?
Model Selection
We can start with visual evidence (what does it look like we should fit?)
Follow up with more statistical evidence:
  > AIC (8.4)

  > BIC (8.4)

  > Adjusted R-squared (8.3) <- what we will cover
Visual evidence

Visual evidence

Model Selection
Adjusted R-squared
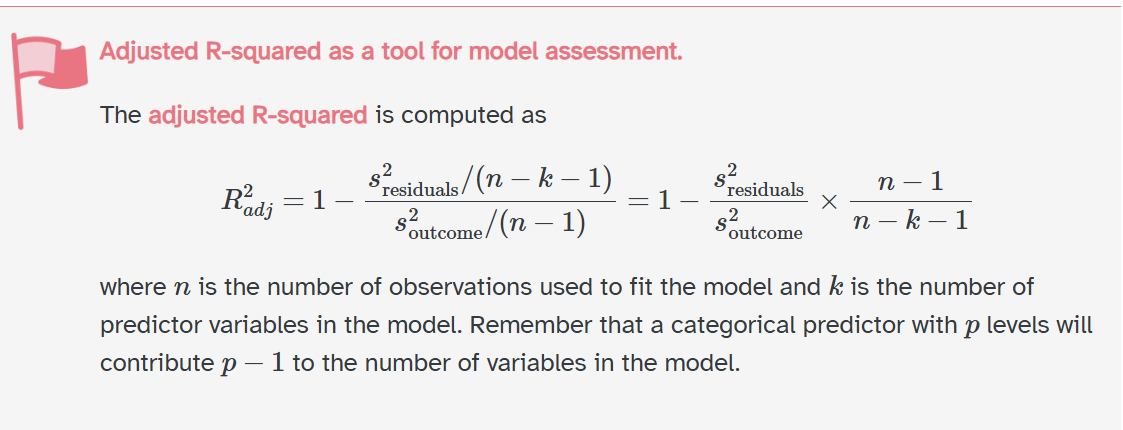
Adjusted R-squared is a modified version of R-squared that has been adjusted for the number of predictors in the model.
Formula
The \(\frac{n-1}{n-k-1}\) acts as a “penalty” based on the number of predictors (k)

Takeaway: If you add a useful predictor, adjusted \(R^2\) will still increase because the \(s^2 \text{residuals}\) will go down larger than the penalty.
If you add a predictor that is not useful, adjusted \(R^2\) will decrease because of the \(n-k-1\).
