Call:
glm(formula = spam ~ exclaim_mess, family = binomial, data = email)
Coefficients:
Estimate Std. Error z value Pr(>|z|)
(Intercept) -1.91139 0.06404 -29.846 < 2e-16 ***
exclaim_mess -0.16836 0.02398 -7.021 2.21e-12 ***
---
Signif. codes: 0 '***' 0.001 '**' 0.01 '*' 0.05 '.' 0.1 ' ' 1
(Dispersion parameter for binomial family taken to be 1)
Null deviance: 2417.5 on 3889 degrees of freedom
Residual deviance: 2318.5 on 3888 degrees of freedom
AIC: 2322.5
Number of Fisher Scoring iterations: 7Logistic Regression II
Lecture: ???
NC State University
ST 511 - Fall 2024
2024-11-18
Checklist
– Keep up with Slack
– HW 5 (late window tonight by 11:59)
– HW 6 has been released (due Tue 26th at 11:59; our last HW!)
– Quiz 11 (released Wednesday; due Sunday Nov 24; our last Quiz!)
– Don’t forget about the statistics experience (Due Dec 6th)
Announcements
– You are allowed one front+back note sheet on the final exam
  > It must be hand-written
  > I will also provide you a formula sheet + get it posted to our website ~ 1 week (if not sooner) before the final exam
– I suggest writing things such as..
  > General interpretations (slope coefficient; p-value; etc)
  > "Conversational" questions to help discover answers (what is my explanatory variable; is it categorical or quantitative; if categorical, how many levels?)
Announcements
Exam-1 in class corrections should be in by tonight
  > You only see on Gradescope of correct vs incorrect, but no points assigned
  > I didn't want those points to be assigned to HW-3, and am adding them to your in-class exam
Class Evaluation
We are going to take 5-minutes to fill out the course evaluation: http://go.ncsu.edu/cesurvey
These are important!
> I take them very seriously, and will read them after the semester
> The department takes them very seriously
You are my favorite class I’ve ever taught at NC State!

Goals for today
– Finish logistic regression
– Talk more about regression
Last time: Set the stage
– How is logistic regression different than linear regression?
– What can we do with a logistic regression model?
We are interested in predicting if an email is spam or not by the number of exclamation points an email contained.
\(\widehat{ln(\frac{p}{1-p})}\) = \(\widehat{\beta_o} +\widehat{\beta}_1\text{ex_points}\)
\(\hat{p} = \frac{e^{\widehat{\beta_o} + \widehat{\beta_1}\text{ex_points}}}{1 + e^{\widehat{\beta_o} + \widehat{\beta_1}\text{ex_points}}}\)
Log-odds
\(\widehat{ln(\frac{p}{1-p})}\) is the log odds
  > where the numerator is probability (odds) of a success
  > and the denominator  is the probability (odds) of a failure
Our model
We are going to calculate probabilities with our model. Let’s practice how to write out our model in proper notation
Our model
\(\widehat{ln(\frac{p}{1-p})}\) = \(-1.911 - 0.168*\text{ex_points}\)
Probabilities
At the end of last class, we predicted the probability of a spam email when the number of exclamation points is equal to 10. How does that change our model below?
\[\hat{p} = \frac{e^{-1.911 - 0.168*\text{ex_points}}}{1 + e^{-1.911 - 0.168*\text{ex_points}}}\]
Probabilities
\[\hat{p} = \frac{e^{-1.911 - 0.168*\text{ex_points}}}{1 + e^{-1.911 - 0.168*\text{ex_points}}} = 0.0268\]
The probability of a randomly sampled email being spam with 10 exclamation points is estimated to be 2.68%.
In R
In R
Without type = response, R computes the log odds!
Questions on logistic regression?
Logistic Regression for Classification
We can also use logistic regression for classification! That is, we can set a threshold to classify new observations as a success (spam) or failure (no spam)
Classification

Classification
Suppose you are a data scientist working on a spam filter. You must determine how high the predicted probability must be before you think it would be reasonable to call it spam and put it in the junk folder (which the user is unlikely to check).
What are some tradeoffs you would consider as you set the decision-making threshold? Discuss with your neighbor.
Classification

Takeaways
– We use logistic regression with categorical (binary) response variable
– Use the logit link function to restrict probabilities to be on the appropriate scale [0,1]
– Can use logistic regression to estimate probabilities, calculate odds ratios, and set up a classification model!
Regression discussion
Regression
– Simple linear regression (SLR)
– Multiple linear regression (MLR)
– Logistic regression
When does it make sense to use linear regression?
We always check for independence (in both logistic and linear regression).
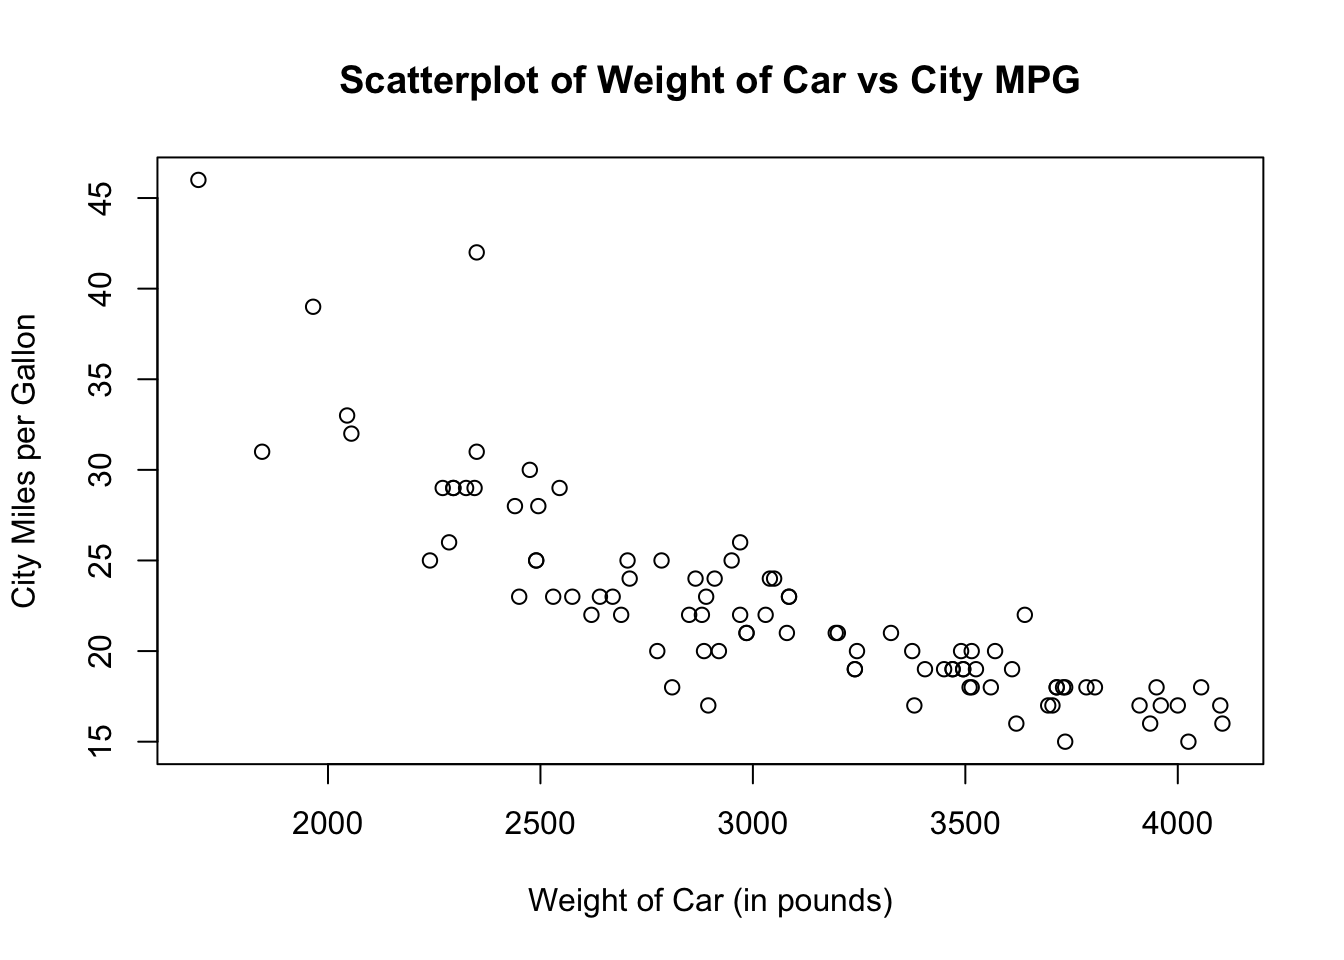
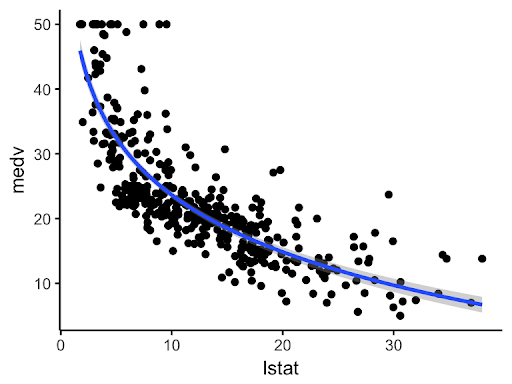
For linear regression, we can ask ourselves, is there evidence of a linear relationship between x and y?
Linear Model
Are we justified to fit a linear relationship?

Linear Model
Are we justified to fit a linear relationship?

Extension: (will not be tested on)
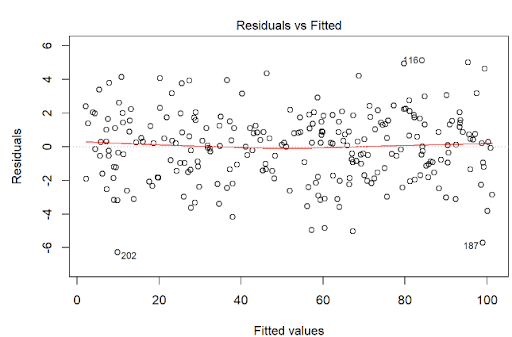
We can make residual vs fitted plots in linear regression, and look for a trend. If we see a random scatter, linearity is not violated.

Extension: (will not be tested on)
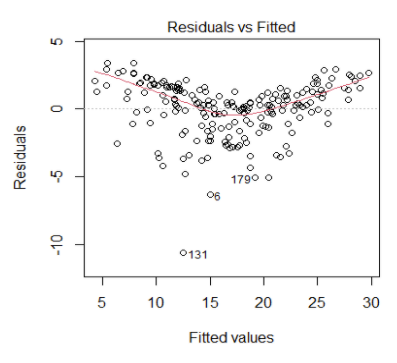
If we see a trend, it is evidence to suggest that linearity is violated

Outliers
We also need to check for outliers. Outliers can influence the coefficients of regression models (both linear and logistic).
Why? What is an outlier?
