Quiz-5
Short answer solutions
Question:
Suppose that, in the smoking example, the researchers calculated a Z-statistic of 3.98.
What does the value of this Z-statistic tell us about our sample statistic in relation to the null hypothesis value? Be specific.
Solution:
We can transform (standardize) our statistic to follow a normal distribution using the following formula (when working with categorical variables):
\[ z = \frac{stat-null}{SE} \]
This new z-statistic is assumed to follow the standard normal distribution with a mean of 0, and a standard error of 1.
The value of the z-statistic shares how many standard errors our observed statistic is away from the null value. For this question, a z-statistic of 3.98 suggested that our observed statistic is 3.98 standard errors above the assumed null value for this hypothesis test.
Question:
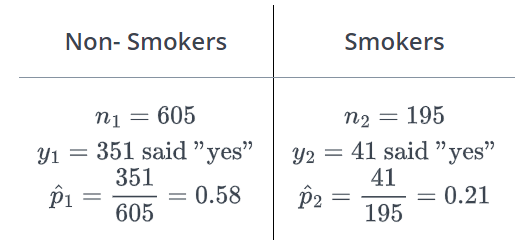
Time magazine reported the result of a telephone poll of 800 adult Americans. The question posed of the Americans who were surveyed was: “Should the federal tax on cigarettes be raised to pay for health care reform?” The results of the survey were.

Specifically, the researchers are interested in if their smoking status impacts their response to wanting a federal tax on cigarettes or not.
Describe,in detail, how one observation on a sampling distribution under the assumption of the null hypothesis is created.
Solution:
The question asks us about an observation on the sampling distribution under the assumption of the null hypothesis. We know that the null hypothesis for a difference in proportions is independence, or that the true proportion for those who favor a tax is the same across the smoking and non-smoking groups.
Because we assume that the groups do not matter, we will shuffle all of our origional data together. Next, we will permute (shuffle) out observations into two groups, one group of 605 observations, and one group of 195 observations. Next, we will take the proportion of yes over the respective totals, and subtract the proportions. The difference in simulated proportions is one dot (observation) on the sampling distribution under the assumption of the null hypothesis.
