# good
iris |>
  ggplot(aes(x = Sepal.Width, y = Sepal.Length, color = Species)) +
  geom_point() +
  labs(
    x = "Sepal width, in cm",
    y = "Sepal length, in cm",
    title = "Sepal length vs. width of irises"
  )

# also good

iris |>
  ggplot(
    aes(
      x = Sepal.Width,
      y = Sepal.Length,
      color = Species
    )
  ) +
  geom_point() +
  labs(
    x = "Sepal width, in cm",
    y = "Sepal length, in cm",
    title = "Sepal length vs. width of irises"
)Tidyverse style guide
How you can style code (and how R can help you do it)
Note I try my hardest to follow these rules when coding in class. However, due to the fast paced nature, I may make a mistake. On homeworks + exams where you have time to style your code, please abide by the following guidelines.
The style guidelines for this course can be found below.
You may also consider returning each argument on a new line if this helps you read your code more efficiently. Example:
styler
Please see the documentation for styler.
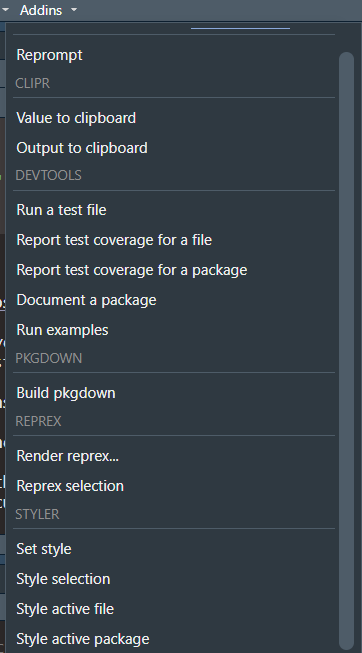
We can use this package to implement the tidyverse style guidelines to select code, or to an entire document. Here are the steps.
- Run
install.packages("styler)in your console
3 (optional + suggested to start): Highlight the code you wish to style by clicking before your code, and bringing your cursor down to the end of your code.
Locate the
 above the Source panel.
Click Addins, and see the Styler options

-   Click `style selection` if you highlighted code to style

-   Click `style active file` if you want your entire document to be styled
The default is tidyverse_style.
